By Dennis Pennington, MSU wheat systems specialist
The recent dry spell and high temperatures have growers and agronomists asking: “How will this weather impact wheat yields?” This article will provide an overall summary of conditions and links to resources.
The extent of droughty conditions and high temperatures vary by location. The first step in determining potential impact on wheat yields is to find rainfall and temperature data for your location. Growth stage is also very important.
Impacts of drought and high temperatures are not the same across all growth stages. There are many great resources out there to help you assess the potential impact on your crop. Here are a few of them:
Temperature
Dr. Romulo Lollato and Dr. Erick DeWolf from Kansas State University wrote a very good article describing the growth stages and impacts of high temperatures. Click here to read that article.
Please take a moment to read it to get a better understanding of how heat stress impacts wheat. Here are some of its key points:
- The “critical period” is when the number of seeds per spikelet are determined; that period lasts from 20 days prior to flowering to 10 days past flowering.
- Pollen formation begins 5-7 days prior to flowering and extends 3 days past flowering; this stage is particularly sensitive to heat stress.
- Temperatures above 88°F can cause problems with pollen production and fertilization.
- Heat stress after flowering is complete will have less yield impact.
Drought
In many locations, Michigan wheat fields have received <1 inch of rain in the last 30 days. Wheat uses about 0.19 inches of water/day when the temperature is 75°F. That number jumps to 0.25 inches of water used when the temperature reaches 85°F.
When there is a lack of rainfall, wheat must draw water from soil reserves. Less water is available in coarse-textured soils. Knowing how much water your soil can provide is useful information when assessing potential water stress on wheat.
Click here for more information including irrigation recommendations for wheat. While we are not in severe drought conditions at this time, there are some areas in our region that are beginning to show signs of drought. (See Figure 1 below).
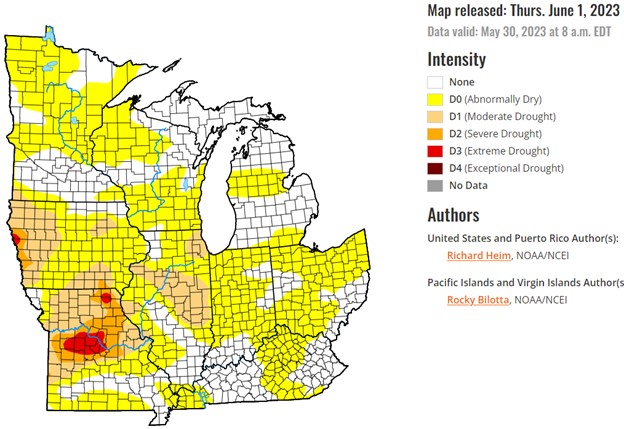
Figure 1. US Drought Monitor as released on June 1, 2023. Maps and information can be found at https://droughtmonitor.unl.edu/CurrentMap.aspx.
– – – – – –
Weather Data
Go to the MSU Enviroweather website to find the weather station nearest to you.
Click here to find your local rainfall data.
Meteograms are useful depictions of weather data for the past week. You can find them here (see example in Figure 2). The daily high temperature is less useful in determining how much heat stress the wheat crop has undergone.
Meteograms provide an average temperature for every 5-minute block of time. This allows us to track how much time the temperature was over the threshold each day. This provides a better picture of potential heat stress.
The weather stations at Richville, Sandusky and Blissfield document 1 inch of rain in the last month, give or take a few days. At Mt. Pleasant, you have to go back 47 days to get 1 inch of accumulated rainfall. Central Michigan is in the beginning stages of drought.
Temperatures week of May 27-June 2. In terms of temperature, Richville was the hottest of the four sites accumulating 880 minutes or 14.7 hours at damaging temperatures. Mt. Pleasant temps were similar to Richville. Blissfield was cooler with only 6.3 hours at or above 88°F and Sandusky has had none.
So, to answer the question “how much has the high temperatures impacted wheat yields?” – it depends on where you are. It also matters what growth stage your wheat is at. Remember, the pollen production and fertilization (7-10 day period) is the most sensitive to heat stress. See data in Table 1.
| Richville | Sandusky | Mt. Pleasant | Blissfield | |
| How far back in the calendar do I go to accumulate 1″ of rainfall? (days) | 34 | 31 | 47 | 33 |
| Total number of minutes (> 88°F) | 880 | 0 | 850 | 375 |
| Total number of hours (> 88°F) | 14.7 | 0.0 | 14.2 | 6.3 |
Table 1. Number of days it has taken to accumulate 1” of rainfall (top row). Amount of time temperature reached 88°F or higher for the week of May 27 through June 2, 2023 (rows 2-3). (Data downloaded from https://enviroweather.msu.edu/weathermodels/meteogram on June 3 at 11 a.m.)
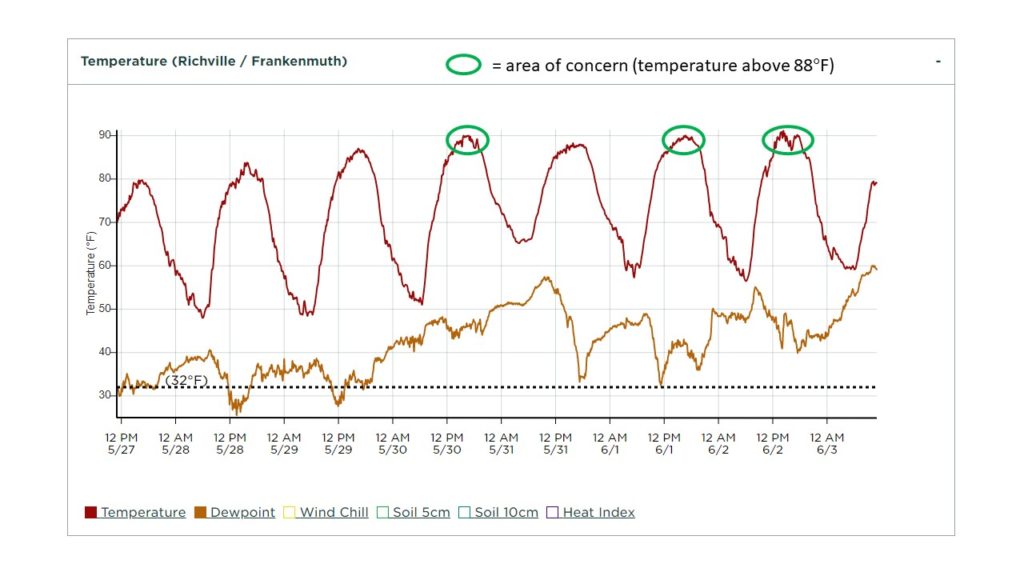
Figure 2. Meteogram from Richville weather station from May 27-June 2, 2024. Note the area highlighted in green where temperatures exceeded 88 degrees Fahrenheit.
– – – – – –
Bottom Line
- Several factors influence the level of yield response including temperature, water availability and wheat growth stage.
- Water and heat stress can lower yield potential in wheat.
- Pollen formation and flowering occurs over a 7-10 day window and is the most sensitive time to temperatures above 88°F.
- Lack of rain or soil moisture during this time will exacerbate the problem.
- Scout your wheat crop regularly, documenting the dates and growth stage to assess potential damage to wheat yields.
- There are many resources available to help you quantify the weather and determine potential impact.